*توجه *توجه برای مشاهده مطلب و یا دانلود فایل مورد نظر خود به پایین همین پست مراجعه گردد
Mid-Latitude Winter-Dry
- Köppen Classification - Cw and Dw.
- Maritime Tropical air masses in summer and Continental Polar air masses in winter.
This climate is characterized by a strong seasonal pattern of both temperature and precipitation. The normal location of the Mid-Latitude Winter-Dry climate is in the interior of the continents in the mid-latitudes. This continental location causes a large annual temperature range because of continentality.
This climate receives Maritime Tropical air masses in the summer with occasional Continental Tropical air masses from the adjacent deserts. Summers are hot and humid with intense summer convectional storms. Continental Polar air masses are dominant in the winter with an occasional outbreak of Maritime Polar air. Continental Polar air masses are associated with cold, dry weather conditions. Precipitation mainly occurs in the summer from thunderstorm activity. The mid-latitude cyclone produces a smaller quantity of precipitation in the winter.
Cw - Omaha, Nebraska, USA 41° N , Elevation: 298 m
| Jan. | Feb. | Mar. | Apr. | May | June | July | Aug. | Sept. | Oct. | Nov. | Dec. | Year | |
| Temp. ° C | -5 | -3 | 3 | 11 | 17 | 23 | 26 | 25 | 19 | 13 | 4 | -2 | 11 |
| Precip. mm | 21 | 24 | 37 | 65 | 88 | 115 | 86 | 101 | 67 | 44 | 32 | 20 | 700 |
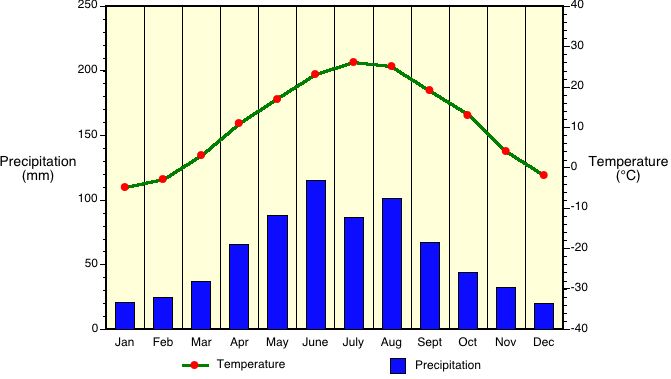
Figure 7v-18: Mean monthly temperature and precipitation values for Omaha, USA.
Dw - Calgary, Canada 51° N , Elevation: 1140 m
| Jan. | Feb. | Mar. | Apr. | May | June | July | Aug. | Sept. | Oct. | Nov. | Dec. | Year | |
| Temp. ° C | -10 | -9 | -4 | 4 | 10 | 13 | 17 | 15 | 11 | 5 | -2 | -7 | 4 |
| Precip. mm | 17 | 20 | 26 | 35 | 52 | 88 | 58 | 59 | 35 | 23 | 16 | 15 | 444 |
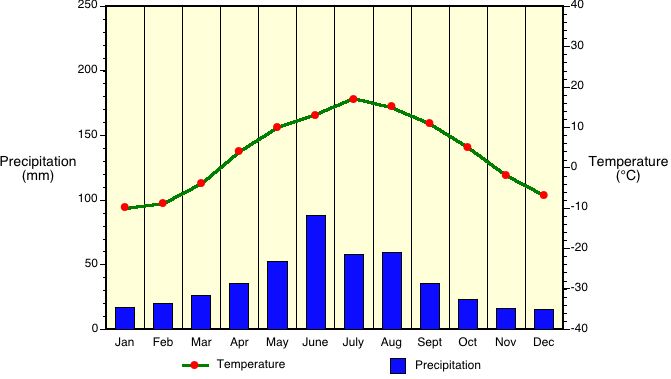
Figure 7v-19: Mean monthly temperature and precipitation values for Calgary, Canada.
Mid-Latitude Summer-Dry
- Köppen Classification - Cs.
- Summer weather is dominated by Continental Tropical air, while in the winter, Maritime Polar air masses are frequent.
The Mid-Latitude Summer-Dry climate is found on the western margins of the continents between 30 to 40° of latitude. Usually, this climate does not spread into the continents very far. This climate is often called a Mediterranean climate.
Precipitation falls mainly in the winter in this climate via the mid-latitude cyclone. During the summer these areas are influenced by stable subtropical highs, that give them dry, warm weather.
Cs - Santiago, Chile 33.5° S , Elevation: 512 m
| Jan. | Feb. | Mar. | Apr. | May | June | July | Aug. | Sept. | Oct. | Nov. | Dec. | Year | |
| Temp. ° C | 19 | 19 | 17 | 13 | 11 | 8 | 8 | 9 | 11 | 13 | 16 | 19 | 14 |
| Precip. mm | 3 | 3 | 5 | 13 | 64 | 84 | 76 | 56 | 30 | 13 | 8 | 5 | 360 |
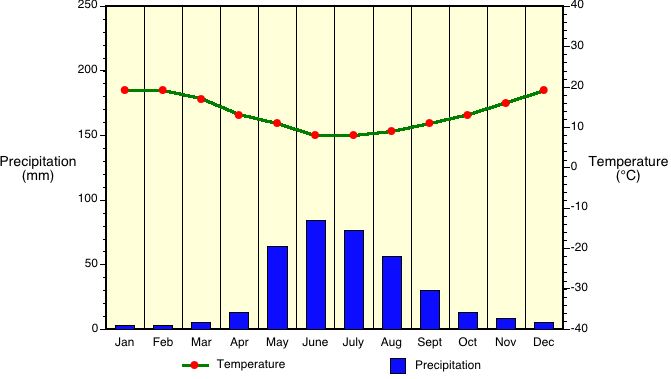
Figure 7v-20: Mean monthly temperature and precipitation values for Santiago, Chile.
Cs - Los Angeles, USA 34° N , Elevation: 37 m
| Jan. | Feb. | Mar. | Apr. | May | June | July | Aug. | Sept. | Oct. | Nov. | Dec. | Year | |
| Temp. ° C | 13 | 14 | 15 | 17 | 18 | 20 | 23 | 23 | 22 | 18 | 17 | 15 | 18 |
| Precip. mm | 78 | 85 | 57 | 30 | 4 | 2 | 0 | 1 | 6 | 10 | 27 | 73 | 373 |
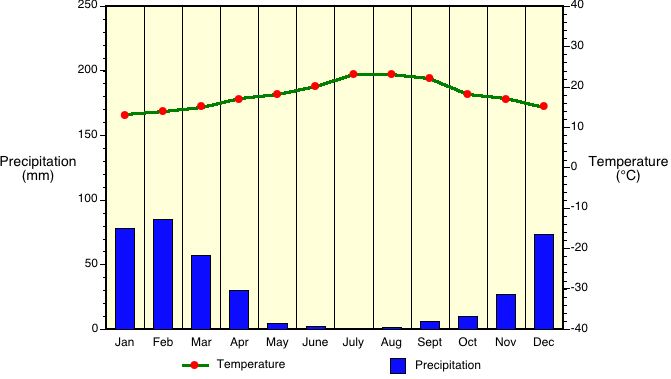
Figure 7v-21: Mean monthly temperature and precipitation values for Los Angeles, USA.
Cs - Rome, Italy 42° N , Elevation: 131 m
| Jan. | Feb. | Mar. | Apr. | May | June | July | Aug. | Sept. | Oct. | Nov. | Dec. | Year | |
| Temp. ° C | 8 | 8 | 10 | 13 | 17 | 22 | 24 | 24 | 21 | 16 | 12 | 9 | 15 |
| Precip. mm | 76 | 88 | 77 | 72 | 63 | 48 | 14 | 22 | 70 | 128 | 116 | 106 | 881 |
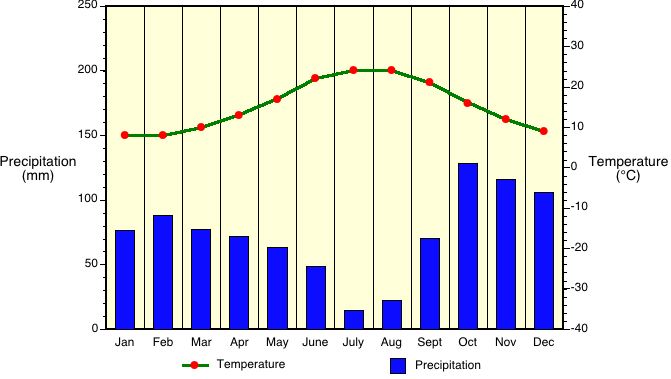
Figure 7v-22: Mean monthly temperature and precipitation values for Rome, Italy.
Polar Tundra
- Köppen Classification - ET.
- Maritime Polar in summer and Continental Polar or Arctic in winter.
The polar tundra climate is characterized by cold winters, cool summers, and a summer rainfall regime. Areas experiencing this climate are the North American Arctic coast, Iceland, coastal Greenland, the Arctic coast of Europe and Asia, and the Southern Hemisphere islands of McQuarie, Kerguelen, and South Georgia. Annual precipitation averages less than 250 mm for most locations and most of this precipitation falls during the summer.
ET - Isachsen, Canada 79° N , Elevation: 35 m
| Jan. | Feb. | Mar. | Apr. | May | June | July | Aug. | Sept. | Oct. | Nov. | Dec. | Year | |
| Temp. ° C | -35 | -37 | -35 | -24 | -12 | 0 | 4 | 1 | -8 | -19 | -28 | -32 | -19 |
| Precip. mm | 2 | 2 | 1 | 4 | 8 | 3 | 22 | 23 | 18 | 10 | 4 | 2 | 98 |
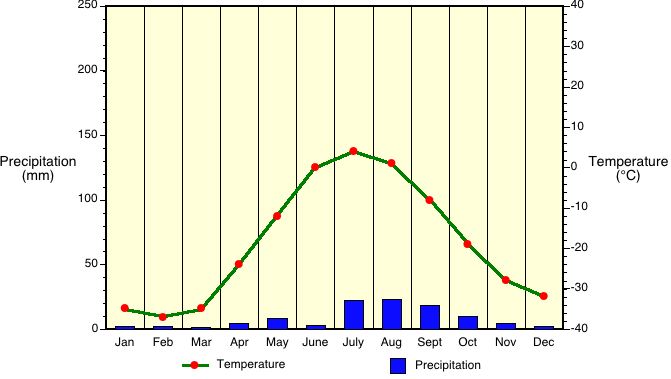
Figure 7v-23: Mean monthly temperature and precipitation values for Isachen, Canada.
ET - Barrow, Alaska, USA 72° N , Elevation: 9 m
| Jan. | Feb. | Mar. | Apr. | May | June | July | Aug. | Sept. | Oct. | Nov. | Dec. | Year | |
| Temp. ° C | -25 | -28 | -26 | -19 | -7 | 1 | 4 | 3 | -1 | -10 | -19 | -24 | -13 |
| Precip. mm | 5 | 4 | 4 | 4 | 4 | 8 | 22 | 25 | 16 | 12 | 6 | 4 | 113 |
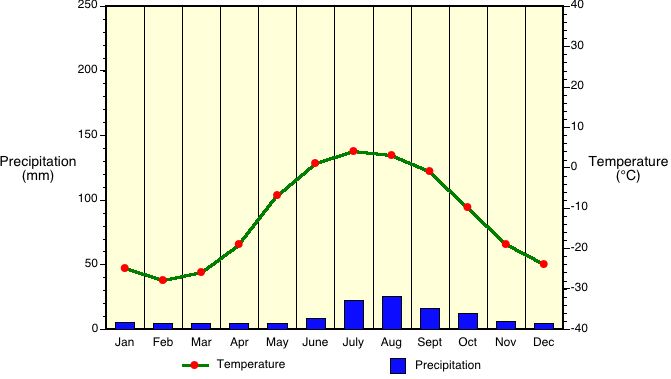
Figure 7v-24: Mean monthly temperature and precipitation values for Barrow, USA.
Polar Ice Cap
- Köppen Classification - EF.
- Continental Arctic and Continental Polar air masses dominate.
Polar ice cap climates are located in the high latitudes over continental areas, like Greenland and the Antarctica. This climate type covers a vast area of the planet. For half of the year no solar radiation is received. During the summer months, available insolation is fairly high because of long days and a relatively transparent atmosphere. However, the albedo of snow-covered surfaces reflects up 90 percent of the insolation back to space. Average monthly temperatures are all generally below zero° Celsius. Winds are consistent and velocity is high enough to produce blizzard conditions most of the time.
EF - Eismitte, Greenland 71° N , Elevation: 2953 m
| Jan. | Feb. | Mar. | Apr. | May | June | July | Aug. | Sept. | Oct. | Nov. | Dec. | Year | |
| Temp. ° C | -42 | -47 | -40 | -32 | -24 | -17 | -12 | -11 | -11 | -36 | -43 | -38 | -29 |
| Precip. mm | 15 | 5 | 8 | 5 | 3 | 3 | 3 | 10 | 8 | 13 | 13 | 25 | 111 |
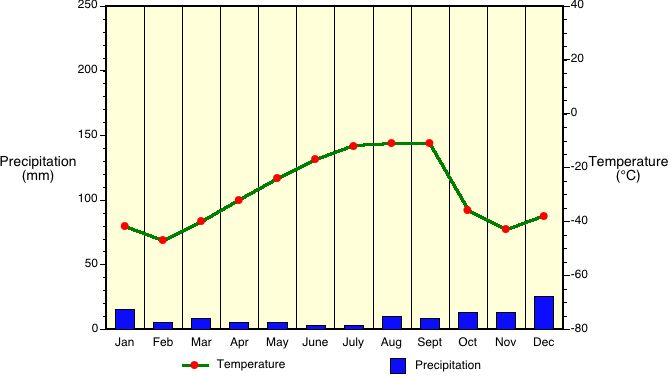
Figure 7v-25: Mean monthly temperature and precipitation values for Eismitte, Greenland.
EF - Plateau Station, Antarctica 79° S , Elevation: 3625 m
| Jan. | Feb. | Mar. | Apr. | May | June | July | Aug. | Sept. | Oct. | Nov. | Dec. | Year | |
| Temp. ° C | -34 | -44 | -57 | -66 | -66 | -69 | -68 | -71 | -65 | -60 | -44 | -32 | -56 |
| Precip. mm | NA | NA | NA | NA | NA | NA | NA | NA | NA | NA | NA | NA | NA |
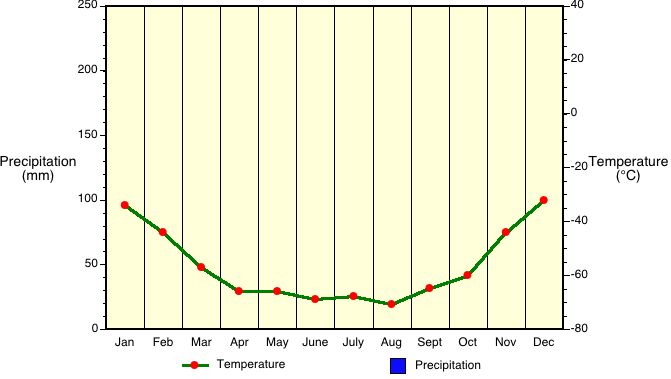
Figure 7v-26: Mean monthly temperature and precipitation values for Plateau Station, Antarctica
 دانلود...
مشخصات مدیر وبسایت

عناوین یادداشتهای وبلاگ
بایگانی آرشیو ماهانه وبسایت
کلمات کلیدی وبسایت
